Advanced Reporting Techniques to Track ROI in 2026 | Kuikwit
Most dashboards give you numbers but no direction. Kuikwit\u2019s advanced reporting techniques turn messy customer conversations into visual analytics, ROI tracking, and data-driven decisions that matter.

Most reporting dashboards give you numbers. Charts. Maybe a pie graph if you are lucky. But none of that means anything if you cannot look at the screen and immediately know what to do next. Advanced reporting techniques are what separate a dashboard that collects dust from one that actually changes how your team operates, and Kuikwit is built around that exact idea.
Quick Questions Before We Get Into It
What Are Advanced Reporting Techniques, Really?
Forget the textbook definition for a second. In plain language, advanced reporting techniques are ways of pulling apart your business data so you can see what is actually going on, not just what happened last Tuesday. Think of it like this. A basic report tells you that your team answered 400 support tickets this month. Great. An advanced report tells you that 60 percent of those tickets came from one product line, most of them hit between 2pm and 5pm UAE time, and your fastest agent resolved them in half the time of everyone else. Same data, totally different story. And that story is what lets you make moves. Reassign workloads, fix the product issue, maybe hire for that afternoon shift. Kuikwit does this by pulling in conversations from WhatsApp, email, Instagram, live chat, all of it, and then layering in visual analytics so you can actually see the patterns without squinting at a spreadsheet. The reporting is not an afterthought bolted on at the end. It is a core part of how the platform works.
Is Kuikwit’s Reporting Actually Worth the Investment?
I get why people ask this. There are a million SaaS tools out there and half of them promise “powerful analytics.” Most of them deliver a few bar charts and call it a day. Kuikwit is different because the reporting ties directly back to your customer conversations. You are not looking at abstract numbers floating in space. You are looking at data that came from real exchanges with real people, and that makes the insights way more useful. If you are still weighing your options, this guide on choosing the right CRM for boosting sales walks through the decision-making process in more detail. If you are a CMO trying to justify software spend, or a support manager who needs to show the C-suite that your team is pulling its weight, this is the kind of reporting that gives you ammunition. Not vanity metrics. Actual evidence of what is working and what is not. For agencies handling multiple client accounts, being able to pull up ROI tracking per client in a few clicks is the kind of thing that keeps contracts renewing.
How Does the Reporting in Kuikwit Actually Work?
So Kuikwit pulls in all your customer interactions from every channel into a single dashboard. Every WhatsApp message, every Instagram DM, every email thread, every live chat conversation. If you are curious about how that unified channel approach works beyond just reporting, there is a solid breakdown in this piece on Kuikwit’s unified communication tool. But the short version is this: once it is all in one place, the platform categorises conversations, tags them by topic and sentiment, and then lets you slice and dice the data however you want. You can filter by date range, by channel, by agent, by response time, by customer sentiment. And the visual layer makes it easy to spot trends without needing a data analyst sitting next to you. The reports are interactive, not static PDFs that someone exports and emails around once a month. You click, you drill down, you get the answer. That is the flow.
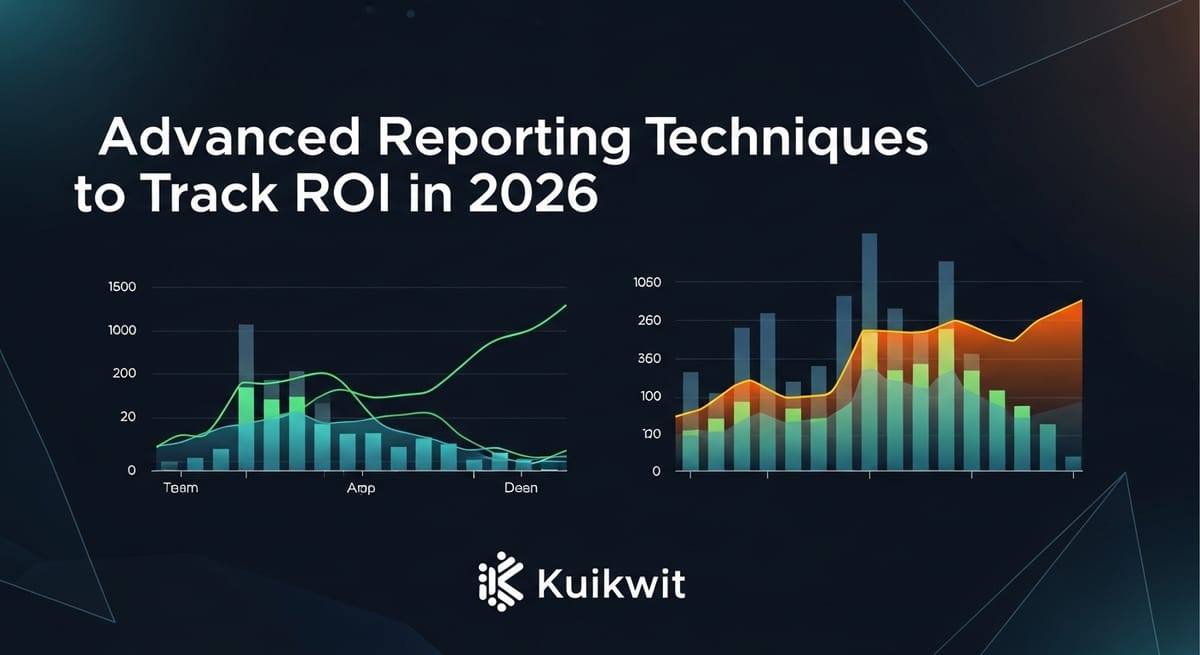
Visual Analytics: Why Seeing Your Data Changes Everything

There is a massive gap between having data and understanding data. I have talked to support managers who have thousands of rows in a spreadsheet and still cannot tell you which channel brings in the most frustrated customers. That is not a people problem. That is a presentation problem. Visual analytics closes that gap in a way that raw tables never will. When you can see a heat map showing that your Instagram DMs spike every Friday evening, or a trend line showing customer sentiment dipping over the past three weeks, you do not need someone to interpret it for you. It clicks instantly. Kuikwit leans into this hard. The dashboards are not just pretty for the sake of it. Every chart, every graph, every colour-coded element is designed to answer a specific question. How fast is my team responding? Which channels are generating the most value? Where are we losing people? You open the dashboard and the answers are right there staring at you. No digging required.
ROI Tracking That Actually Proves Your Point
Here is a thing that drives me up the wall. Companies invest in customer communication tools and then have zero way of measuring whether the investment paid off. They know they are "doing things" with the software. They can feel that things are faster. But when the CFO asks for a number? Blank stares. ROI tracking inside Kuikwit gives you that number. You can see how many conversations turned into conversions. You can track resolution times before and after implementing the platform. You can compare agent performance month over month and see whether the training you ran in February actually moved the needle. For agency owners in the US and UAE who manage multiple brands, this is gold. You are not guessing about results anymore. You are pulling up a screen and saying, here, look, this is what your investment did this quarter. That is a very different conversation to have with a client than “we feel like things are going well.”
Team Performance Metrics That Go Beyond the Basics
Most platforms will tell you how many tickets each agent closed. And look, that is useful to a point. But it is also kind of shallow. Closing a ticket does not mean the customer left happy. It does not tell you whether the agent actually solved the problem or just marked it as resolved to hit a target. Kuikwit’s team performance metrics dig way deeper. You get average response times per agent, per channel. You see resolution quality, not just speed. You get customer sentiment scores attached to individual conversations so you know which agents consistently leave people feeling good and which ones might need coaching. If you want a deeper look at how reporting data feeds into sales team performance, this guide on empowering your sales team with Kuikwit is worth a read. The piece that I think managers underestimate is the comparison view. Being able to put two agents side by side, or compare one team’s numbers against another, or benchmark this month against last month. That is where the real conversations about staffing, training, and process improvement start happening. Not from gut feelings. From the data.
Customer Sentiment: Reading Between the Lines of Every Conversation
Here is something most reporting tools miss entirely. The mood. The vibe. Whatever you want to call it. A customer can send a polite message and still be absolutely furious underneath, and a good support agent picks up on that immediately. AI-powered customer sentiment analysis does the same thing at scale. Kuikwit tags conversations with sentiment scores so you can see, at a glance, how your customer base is feeling. Not just today. Over time. You can track whether a product launch improved sentiment or tanked it. You can spot seasonal patterns. You can catch a negative trend early before it turns into a wave of bad reviews. This is especially valuable if you are running support across regions. Customer sentiment in Dubai might look completely different from sentiment in Texas, and knowing that changes how you allocate resources and train your team. One-size-fits-all support does not work anymore. The data proves it.
Data-Driven Decisions: From Numbers to Action
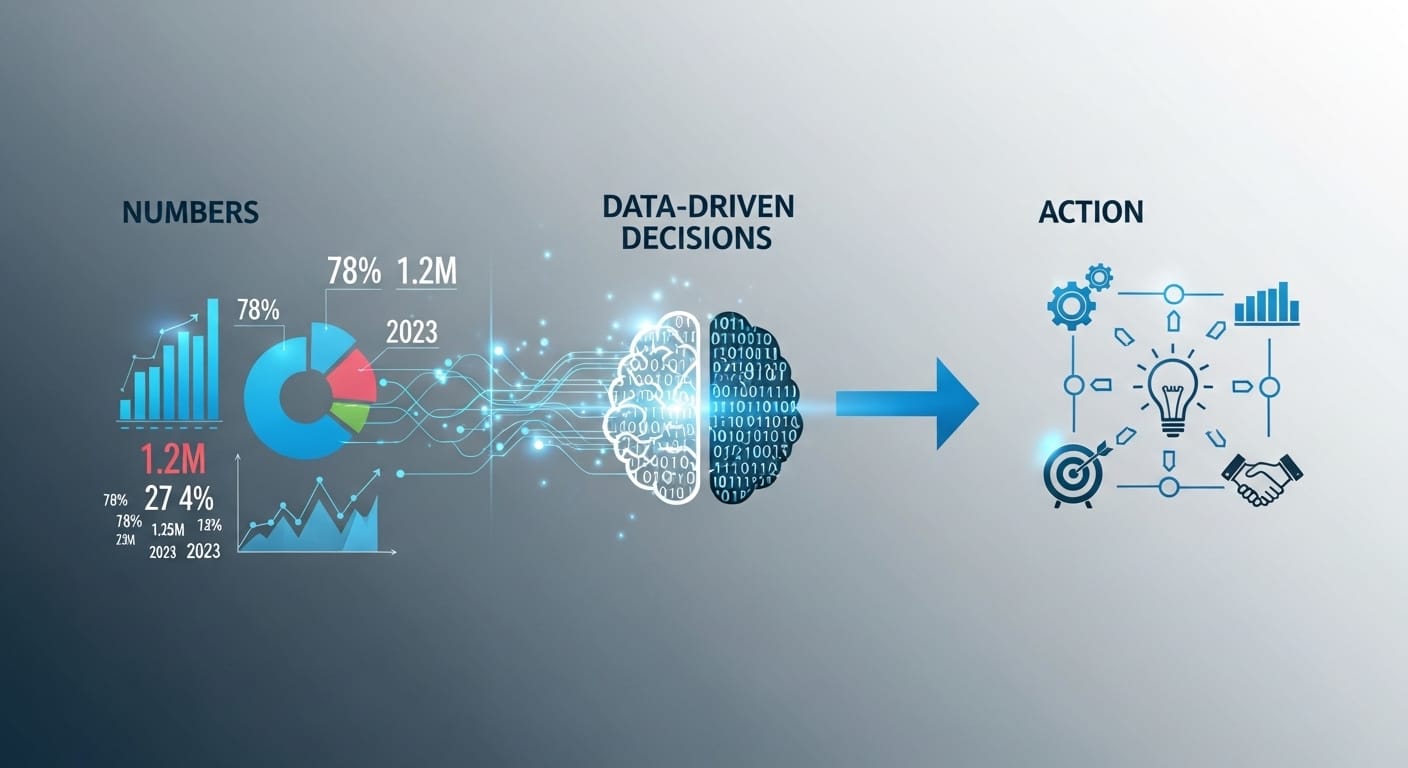
I keep hearing the phrase “data-driven decisions” thrown around like it is self-explanatory. It is not. Having data does not make you data-driven. Acting on it does. And acting on it requires data that is clean, accessible, and easy to interpret. That is the gap Kuikwit fills. The platform is not just collecting data for the sake of it. Every metric ties to a decision. High average response time on WhatsApp? Maybe you need another agent on that channel during peak hours. Customer sentiment dropping on a specific product?
Flag it for the product team before it becomes a support crisis. One agent consistently outperforming the rest? Figure out what they are doing differently and build a training programme around it. Reporting data also feeds directly into how you handle leads, and if that side of things needs work, these lead management tips are a practical starting point. These are not hypothetical scenarios. These are Tuesday afternoon decisions that support managers and CMOs are making right now, because they have the reporting to back them up. That is what data-driven actually means when it is not just a slide in someone’s pitch deck.
How Advanced Reporting Techniques Change the Game for Agencies
If you run an agency, especially one handling customer comms for multiple clients, you know the reporting headache. Every client wants to see different things. Some care about speed. Some care about volume. Some want to know how their brand is being perceived. Pulling custom reports for each client used to mean hours of spreadsheet wrangling. With Kuikwit, you set up reporting views per client and the data populates automatically. Your account manager opens the dashboard, screenshots the relevant graphs, or better yet shares a live link, and the client sees exactly what they need without you spending half your Friday afternoon in Excel. Industries like commercial real estate are a great example of where this matters, and if that is your space, the CRM solutions for commercial real estate piece goes deeper into that vertical. For agencies in competitive markets like the US and UAE, this kind of efficiency is not a nice-to-have. It is survival. The agency that can show results fastest and most clearly is the one that keeps the contract.
Basic Reporting vs Advanced Reporting: A Quick Side-by-Side
|
What You Are
Looking At |
Basic
Reporting |
Advanced
Reporting (Kuikwit) |
|
Ticket
Volume |
Total
count per week or month |
Broken
down by channel, time of day, agent, and sentiment |
|
Response Time |
Average across all agents |
Per agent, per channel, with trend
lines over time |
|
Customer
Satisfaction |
Maybe
a star rating after close |
AI
sentiment scoring on every conversation, tracked over weeks |
|
ROI Measurement |
Not typically included |
Conversion tracking, time saved, cost
per resolution |
|
Team
Comparison |
Leaderboard
by tickets closed |
Multi-metric
comparison including quality and sentiment |
|
Client Reporting (Agencies) |
Manual exports, one-size-fits-all |
Custom dashboards per client,
auto-populated, shareable |
Mistakes People Make With Their Reporting (And How to Avoid Them)
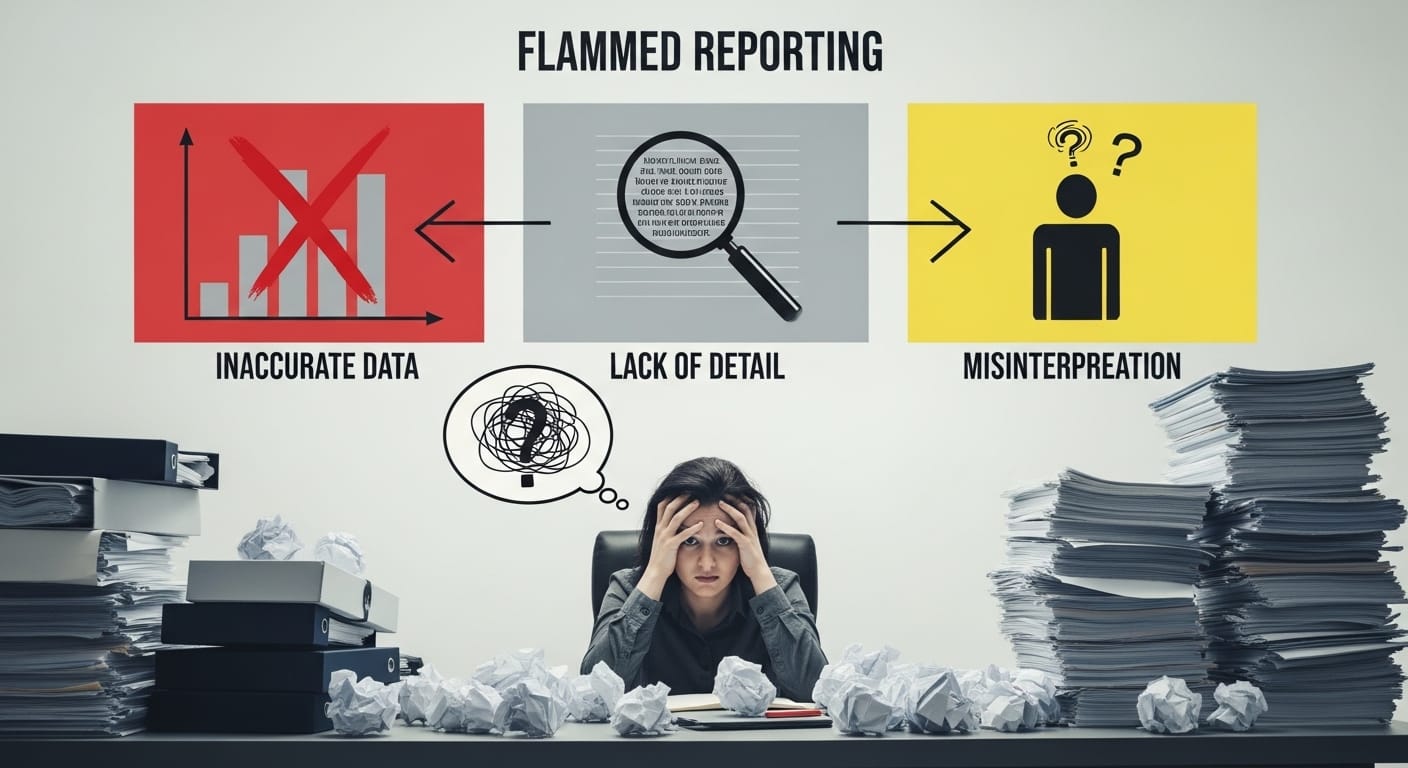
First one, and I see this constantly. People track too many things. They set up dashboards with thirty metrics and then never look at any of them because it is overwhelming. Pick five to seven metrics that directly tie to your goals. That is it. If it does not answer a question you are actively asking, take it off the screen. Kuikwit lets you customise your dashboard view, so use that. Do not just accept the default layout and hope for the best.
Second mistake. Reporting without context. A number by itself is meaningless. Your average response time is 4 minutes. Cool. Is that good? Bad? Compared to what? You need benchmarks. Compare against last month, against your industry average, against your own targets. Without context, you are just staring at digits on a screen and nodding. Context turns data into insight. That is the difference.
Third, and this one hurts the most. People pull reports but never act on them. The report becomes a ritual. Every Monday someone opens the dashboard, nods, maybe mentions a number in a meeting, and nothing changes. If a report is not leading to a decision or an action, it is wasting everyone’s time. Build a habit of asking, “what are we going to do differently because of this?” after every reporting review. Otherwise, you are just doing reporting theatre.
Where This Is All Heading
Reporting is not going to stay where it is right now. The tools are getting smarter, faster, more predictive. Platforms like Kuikwit are already moving toward showing you what is likely to happen next, not just what happened yesterday. Predictive analytics, anomaly detection, automated suggestions. That is the direction. And the businesses that build the habit of actually using their reports now, not just collecting them, are the ones that will get the most out of those features when they land. So yeah. Start with what you have. Get your team used to looking at the numbers regularly. Make decisions based on them. The fancy stuff is coming. But the fundamentals have not changed. Good data, clear presentation, and someone willing to act on what the numbers are saying. That is really all it takes.
Frequently Asked Questions
What does advanced reporting look like in customer support?
They are methods of analysing your support data that go beyond simple counts and averages. Instead of just knowing how many tickets you handled, you understand which channels drive the most issues, which agents perform best under pressure, how customer sentiment shifts over time, and where your team is losing efficiency. It is about turning raw interaction data into insights you can actually do something with.
How does Kuikwit handle reporting across multiple channels?
Kuikwit pulls conversations from WhatsApp, email, Instagram, and live chat into one unified dashboard. The reporting layer sits on top of all of that, so you are not switching between platforms to piece together the full picture. Every metric, whether it is response time, sentiment, or volume, includes data from every channel. You can also filter by individual channel if you want to compare performance across them.
Can I use Kuikwit’s reports to show ROI to my clients or leadership?
Yes, and this is one of the things agencies and support managers use the most. The ROI tracking features let you show time saved, conversion rates linked to customer interactions, and cost per resolution. You can set up custom views for each client or stakeholder so they see exactly the metrics that matter to them without the noise.
What is customer sentiment analysis and why does it matter for reporting?
Customer sentiment analysis uses AI to read the tone and emotion behind customer messages. It tags each conversation with a sentiment score, positive, neutral, or negative, so you can track mood trends over time. This matters because a customer can technically get their issue resolved but still walk away unhappy. Sentiment analysis catches that gap and helps you improve the experience, not just the resolution rate.
How often should I be reviewing my support reports?
At minimum, once a week for a quick check on key metrics. Monthly for a deeper dive where you compare against previous periods and set new targets. If you are in a fast-moving environment or managing a large team, a daily glance at your live dashboard is worth it. The key is consistency. Reports are useless if nobody looks at them regularly.
What metrics should a CMO focus on in Kuikwit’s reporting?
CMOs typically care about customer sentiment trends, ROI on communication spend, channel performance, and how support quality impacts retention. The high-level dashboards in Kuikwit are designed for exactly this. You do not need to dig into individual tickets. You need the thirty-thousand-foot view that tells you whether your customer experience strategy is working.
Is Kuikwit’s reporting useful for small teams or only large operations?
It works for both, honestly. Small teams benefit because the dashboards surface problems quickly without needing a dedicated analyst. If you have got three agents and one of them is struggling on a particular channel, you will see it fast. Larger teams benefit from the comparison and benchmarking features that help manage dozens of people across multiple regions or brands.
Can I export reports from Kuikwit?
Yes. You can export data for presentations, client reports, or internal reviews. But honestly, the better move for most use cases is sharing the live dashboard link. That way whoever you are reporting to sees the most current data instead of a snapshot that was already outdated by the time you exported it.
How does advanced reporting help with team training and coaching?
When you can see individual agent metrics alongside sentiment scores and resolution quality, coaching becomes specific instead of generic. You stop saying “we need to be faster” and start saying “your WhatsApp response times are great but your email responses are averaging double the team benchmark, so let us focus there.” That specificity is what actually improves performance.
What is the difference between data-driven decisions and just looking at reports?
Looking at reports is passive. Data-driven decisions mean you see a number, understand what it means, and then change something because of it. If your sentiment scores drop after a product update, a data-driven response is to flag the product team and adjust your support scripts. Just looking at the report and going “hm, that is lower than last month” and moving on is not data-driven. It is data-aware at best. The reporting only matters if it leads somewhere.